One of the most significant economic developments of the late 19th century was the expansion of the manufacturing industry in the United States. While once an agricultural nation, the American economy was slowly being transformed by the production of new items such as mass-produced clothing, processed foods, typewriters, and the earliest automobiles. These developments can be tracked using FRASER’s primary sources such as The Merchant’s Magazine and Commercial Review and the Commercial and Financial Chronicle, and U.S. Census publications. These publications contain tables and charts detailing figures such as government revenue, the national debt, exports, and imports. Together with other FRASER sources, they can provide a detailed, statistical overview of the growth of the manufacturing industry in the years following the Civil War.
Spurred on by the new wave of technology accompanying the Second Industrial Revolution, manufacturing production expanded dramatically during the latter half[1] of the 19th century—but it can be difficult to determine how much manufacturing grew. The U.S. Census reference work Historical Statistics of the United States: Colonial Times to 1970 is particularly useful for giving us an idea of the growth of aggregate manufacturing, because of its inclusion of specific indexes:[2]
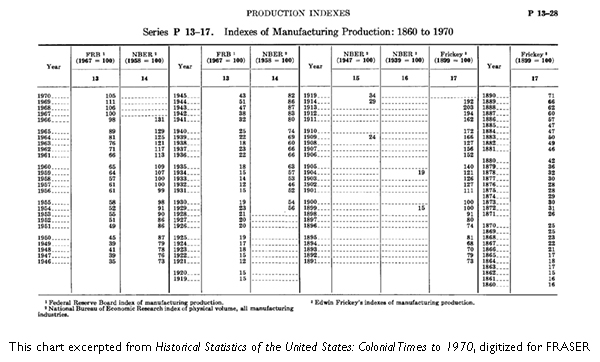
The chart lines up Federal Reserve manufacturing indexes and a National Bureau of Economic Research index (left half of chart) and the Frickey index and NBER indexes from 1919 back to 1840 (right half of chart).
While contemporary data from the period exist, they are mostly reported by sub-industry (such as railroad repair shops[3]), making estimates of manufacturing as a whole difficult to find. One of the few measures of aggregate manufacturing after the Civil War comes from economist Edwin Frickey, whose 1947 index (included in Historical Statistics as the “Frickey index”) covers the years 1860 to 1914.[4] Because this index of industrial production is so much broader in scope than similar indexes covering the period,[5] the Frickey index was very popular and is still referenced today.[6]
Just as no equivalent to modern GDP was available in the early 20th century, there was no reliable measure of manufacturing and industrial production until the Federal Reserve began to collect and publish that information in 1919.[7] The Fed’s data have been published continuously for nearly a century, but not always with the same format or title. Data in the early years of the Fed were published in the Federal Reserve Bulletin, before becoming part of the statistical releases in the 1930s:
Federal Reserve Industrial Production Data |
|
| 1919-1921 | “Production of Manufactured Goods” table in the March 1922 Federal Reserve Bulletin |
| 1919-1927 | “The New Index of Industrial Production” in the March 1927 Federal Reserve Bulletin |
| 1923-1973 | The monthly “National Summary of Business Conditions” in the Federal Reserve Bulletin |
| 1938-1973 | Business Indexes (G.12.3) |
| 1973-1990 | G.12.3 Industrial Production |
| 1990-present | G.17 Industrial Production and Capacity Utilization (The Board’s data download includes revised data back to 1919.) |
Despite this wealth of information, for many years there was a gap between the pre-World War I indexes and the earliest Fed data. In the late 1980s, economists Jeffrey A. Miron and Christina D. Romer developed “A New Monthly Index of Industrial Production, 1884-1940,”[8] a dataset that can help researchers get a fuller picture of historical manufacturing production. Although Miron and Romer’s index of industrial production includes not only manufacturing, but also mining and utilities, it’s possible to use their index to estimate the growth of manufacturing. Using FRED® to graph the two relevant indexes of manufacturing and industrial production from the Federal Reserve Board’s G.17 statistical release shows that the two closely follow each other.
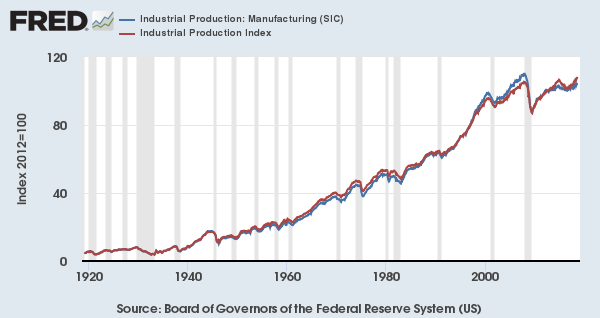
The red line is the Federal Reserve’s industrial production index (manufacturing, mining, and electric and gas utilities), and the blue line is the Fed’s manufacturing index alone.
Although it takes a little detective work, combining Miron and Romer’s index, Frickey’s index, and a century of Federal Reserve data produces a picture of manufacturing production from the start of the Civil War to the present.
[1] Although the Census collected data on “manufactures” as early as 1810, the early data is considered too inaccurate to use in modern economic research. See the National Archives and Records Service report “The Censuses of Manufactures: 1810-1890,” available from the Census Bureau website.
[2] Statistical indexes, which compare values over time to a “base period” (the value at a single point in time), are one of the most common economics methods of communicating growth.
[3] See notes to series P1-12.
[4] All data in the Historical Statistics include notes about their creation. See the note on the composition of Frickey’s index on page 654.
[5] For more on early 20th century indexes of manufacturing production, see future Fed Chair Arthur Burns’s 1934 article “The Growth of Total Production” in the National Bureau of Economic Research volume Production Trends in the United States Since 1870.
[6] See, for example, Joseph Davis. “An Annual Index of U. S. Industrial Production, 1790-1915.” The Quarterly Journal of Economics 119 (4) (2004): 1177-215.
[7] For more on the history of Federal Reserve data publications, see this Inside FRASER post on statistical releases. For more on the industrial production data specifically, refer to Sian Seldin’s 2016 working paper “Federal Reserve Board Statistical Releases: A Publications History,” particularly the flow chart on page 52, and “Industrial Production: Historical Bibliography and Other References” from the Federal Reserve Board of Governors.
[8] Jeffrey Miron and Christina Romer. “A New Monthly Index of Industrial Production, 1884-1940.” National Bureau of Economic Research Working Paper No. 3172, November 1989: 4.
© 2018, Federal Reserve Bank of St. Louis. The views expressed are those of the author(s) and do not necessarily reflect official positions of the Federal Reserve Bank of St. Louis or the Federal Reserve System.