A-C-E-S-T: Always Check Everything Seven Times. That’s how Glenn Sturgis minimizes his mistakes as manager of the big box store Cloud 9 in the NBC sitcom Superstore: “You would be surprised how many mistakes I pick up on the seventh check,” he quips. The same principle applies to economic research. In particular, revisions to published data mean that researchers need to verify data often to make sure that the data we choose fits the question being asked.
As a previous Inside FRASER post has explored, economic data is often revised—sometimes multiple times—to improve initial estimates with additional data. For instance, take one of the most important “headline” data releases, gross domestic product (GDP): If the Bureau of Economic Analysis (BEA) tried to literally count up the final value of every single final good and service produced in the U.S. (which make up GDP, under the textbook definition), it would take years to come up with a number. To speed up the process and make data available to economists, businesspeople, and policymakers when they need it, the BEA relies on scientific sample surveys and other representative data to estimate GDP, then revises its estimates as more data become available.[1]
Part of the purpose of both FRASER and ALFRED (Archival FRED, which captures each official “vintage” or edition of a data point in a FRED series) is to help researchers understand what data were available to decisionmakers at the time a policy was made. But what does that actually look like in practice? This post gives one example, showing how data revisions affect how we research the question “How does the language the Federal Open Market Committee (FOMC) uses to describe one specific economic indicator—in this case, business fixed investment—correlate to the data series itself?”
At the conclusion of every meeting, the FOMC releases a statement recapping its discussions and the key variables it looked at in making any decision. The FOMC has many options in its toolkit, but clairvoyance is not one of them; it has no way of knowing what revisions will be made to the data. Its statements, which impact the markets that closely listen to Fed communication, therefore reflect what the Committee knew at the time, justifying why it decided to make (or not make) a specific decision.[2]
To properly examine why the FOMC enacted certain policy actions, we can’t look at the revised data available now; we have to look at the data as it was available to the FOMC in real time.[3] For the research in this post, we started by looking through meeting statements available in the Federal Open Market Committee Meeting Minutes, Transcripts, and Other Documents collection in FRASER. For this analysis, we downloaded the statements from December 2011 onward, which is when the Committee started explicitly mentioning business fixed investment.[4]
“Business fixed investment” is one component of GDP that typically receives attention from market watchers and policymakers.[5] Also known as “private nonresidential fixed investment,” this data series measures businesses’ investment in equipment, structures, and intellectual property. More “fixed” investment—investment in durable or longer-term stuff—may signal higher degrees of confidence in the strength of the economy.
Because of this, economic journalism can be highly interested in business fixed investment; unfortunately, the news often fails to take into account data revisions that may change or erase previous newsworthy outliers. For instance, some people noticed that business fixed investment fell at an annualized rate of 0.6 percent in the second quarter of 2019 and then fell again at a rate of 3 percent in the third quarter of 2019. As the Wall Street Journal[6] put it in late November of 2019, business fixed investment had its “first consecutive quarterly decline since 2009, data from the Commerce Department’s Bureau of Economic Analysis show.” If we look at the most up-to-date revised BEA data series on FRED, that statement is true: While the growth rate of business fixed investment has dropped below zero on several occasions in recent years, the chart shows that this investment hasn’t declined for two straight quarters since the thick of the Great Recession in 2009. But similar alarm bells rang in 2016[7] when the growth rate of business fixed investment appeared to stay below zero in each of the first three quarters of that year.[8] As new information came in and was incorporated into the regular revisions of the GDP component series, the BEA updated its data to show that, among other changes, business fixed investment actually grew in the second quarter of 2016. A revised series may make a new estimate look like more of an outlier than it actually is.
To track the “advance” estimate of business fixed investment—the initial estimate that the BEA releases for each quarter, before any revisions take place—we looked up the “PNFIC1” series on ALFRED. An ALFRED vintage displays what the data on the main FRED would have looked like if you’d accessed it on a certain day in the past: If you took a time machine back to October 30, 2019, and searched for business fixed investment on FRED, you’d find the same exact data as the “2019-10-30” vintage on ALFRED.
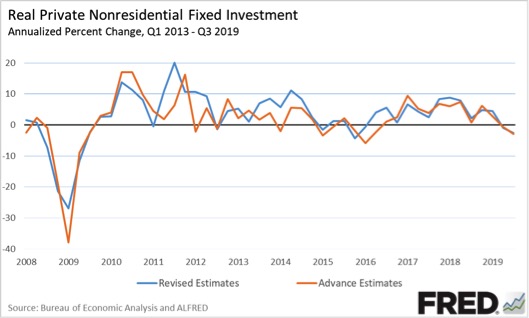
Clicking the “Download” button in the upper right-hand corner of the ALFRED graph and choosing “All Vintages” lets us easily download as many data snapshots as we want. For this analysis, we set the units to “Compounded Annual Rate of Change” and selected vintages from 2008 through the present. As you can see in the chart below, though the advance estimates of business fixed investment generally follow the revised estimates closely, there are periods in which larger revisions cause the series to diverge.
To cross-reference the release dates of the advance estimates (indicated by the date of each vintage in ALFRED) to FOMC language, we looked at the statement from the first FOMC meeting after each release and recorded the key quotes relating to business fixed investment. This cross-referencing showed that there were some broad patterns in how the FOMC talked about business fixed investment: “soft” for lower values and “advancing” for higher values or those that are trending upward. In most cases, data revisions to this series have been relatively minor, so past FOMC statements usually still align to the data as we understand it now.
In a few instances, however, the FOMC’s characterization of the advance estimates no longer fit the revised data. As shown in the figure below, in April 2014, July 2015, and September 2016, the FOMC said that business fixed investment in the prior quarter had either “edged down” or been “soft.” At the time, the available data indicated that business fixed investment had declined in Q1 2014, Q2 2015, and Q2 2016. Now, though, with the benefit of more information, the BEA estimates that business fixed investment actually increased in those quarters.
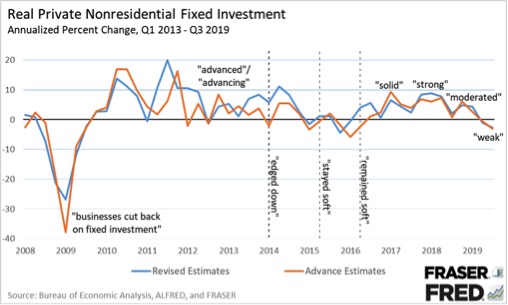
That’s not to say that the FOMC was wrong in those meetings – it simply didn’t have the same information then as we have now. It’s also not correct to say that the initial estimates of data from the BEA were wrong – they too were based on everything that the BEA could have possibly known at the time.
Ultimately, the data collection process in economics will always be a little imperfect. Unlike the physical sciences like chemistry or physics, in economics we typically can’t gather data from controlled experiments, so our data is inherently a bit messy. Sometimes people fill out surveys incorrectly or send them in late, or sometimes we discover better ways to calculate metrics that we then have to apply to past data, for example. When researchers receive new information, we take it into account, revising data as needed. In the end, we make our best inferences and decisions based on what we know at the time.
[1] Bureau of Economic Analysis. “Why Does the BEA Revise GDP Estimates?” BEA’s Official Blog, July 13, 2015.
[2] For more on this, see Kevin L. Kliesen, Levine, Brian Levine, and Christopher J. Waller. “Gauging Market Responses to Monetary Policy Communication.” Federal Reserve Bank of St. Louis Review, Second Quarter 2019, 101(2), pp. 69-91; and, David E. Lindsey. “A Modern History of FOMC Communication: 1975-2002.” FOMC memo, June 24, 2003.
[3] For example, see Athanasios Orphanides. “Monetary Policy Rules Based on Real-Time Data.” American Economic Review, September 2001, 91(4), pp. 964-985.
[4] Prior to this meeting, the FOMC did look at business fixed investment when making its decisions, but it referred to its individual components rather than the series as a whole in its statements.
[5] See speeches on the topic from Federal Reserve officials.
[6] Theo Francis and Thomas Gryta. “U.S. Firms Pull Back on Investment.” The Wall Street Journal, November 24, 2019.
[7] Jeffry Bartash. “U.S. economy running at half speed, GDP shows.” Marketwatch, July 29, 2016.
[8] Kevin Kliesen. “Are Key Investment Indicators Signaling a Recession?” On the Economy Blog, Federal Reserve Bank of St. Louis, August 4, 2016.
© 2019, Federal Reserve Bank of St. Louis. The views expressed are those of the author(s) and do not necessarily reflect official positions of the Federal Reserve Bank of St. Louis or the Federal Reserve System.
